University of Phayao manages water resources across both its main campus and Chiangrai campus through a network of reservoirs, lakes, and recharging pits. The table below summarizes the average rainfall, water flow rate, and storage capacity of these water resources at each campus.
| University and Location | Average Rainfall (mm/hr) |
Water Flow Rate (m³/hr) |
Number of Reservoirs | Capacity of Reservoirs (m³) |
Number of Lakes | Capacity of Lakes (m³) |
Number of Recharging Pits | Capacity of Recharging Pits (m³) |
|---|---|---|---|---|---|---|---|---|
| University of Phayao; main Campus |
50 | 250 | 2 | 540,000 | 1 | 760,000 | 11 | 73,000 |
| University of Phayao; Chiangrai Campus |
60 | 60 | 1 | 180,000 | - | - | 2 | 5,000 |
Target: 50% reduction in piped water usage by 2030 compared to the 2003 baseline.
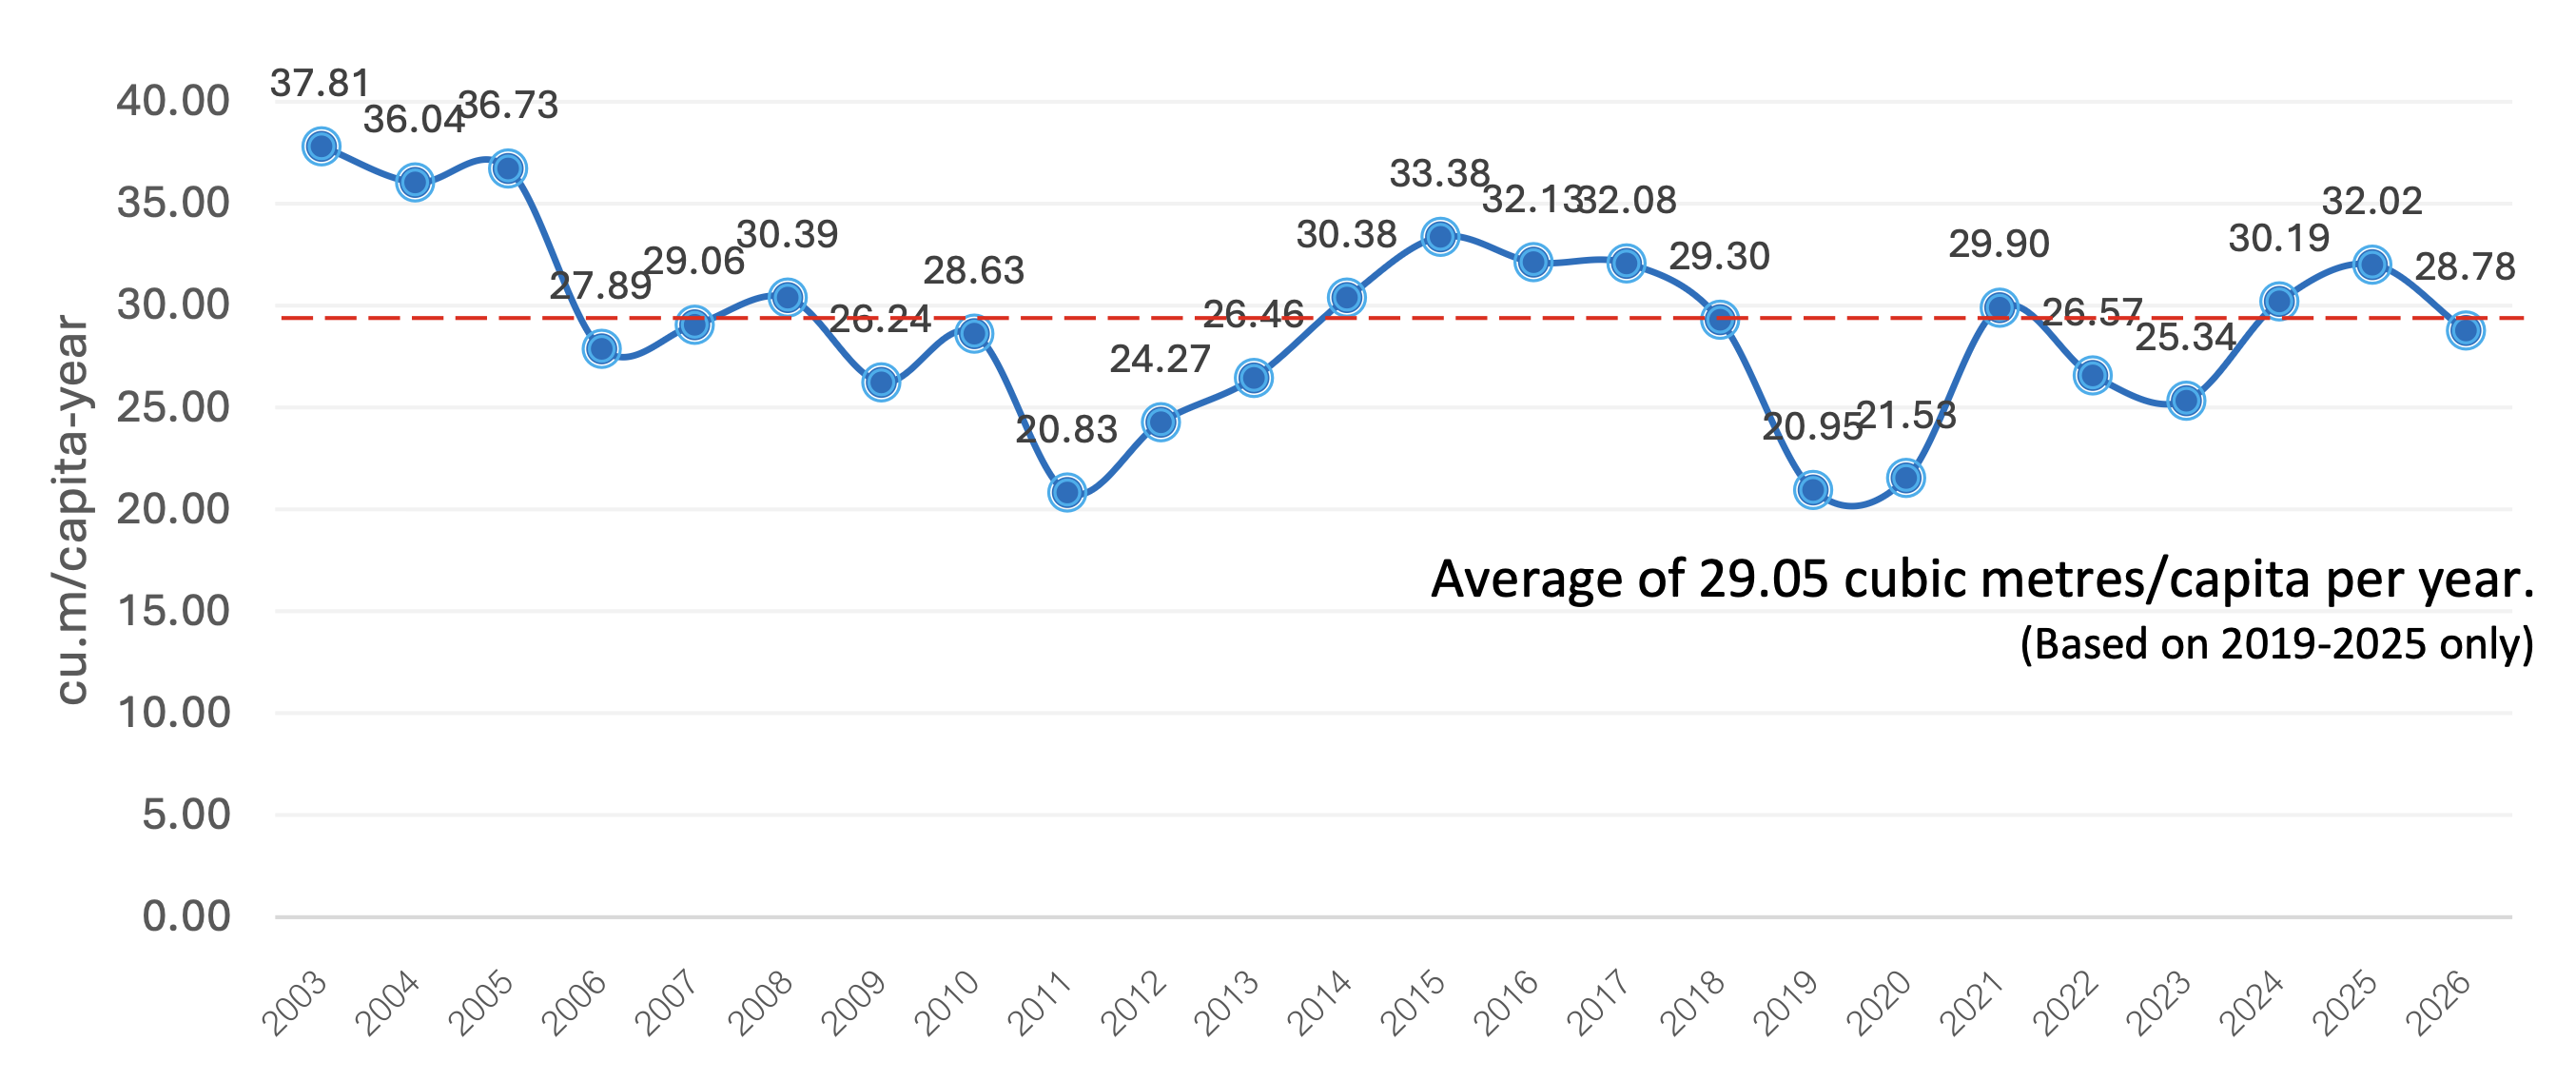
Result: In 2026, a 31.38% reduction in piped water usage was achieved compared to the 2003 baseline, due to the implementation of water conservation measures and the installation of eco-sensor water-saving appliances.
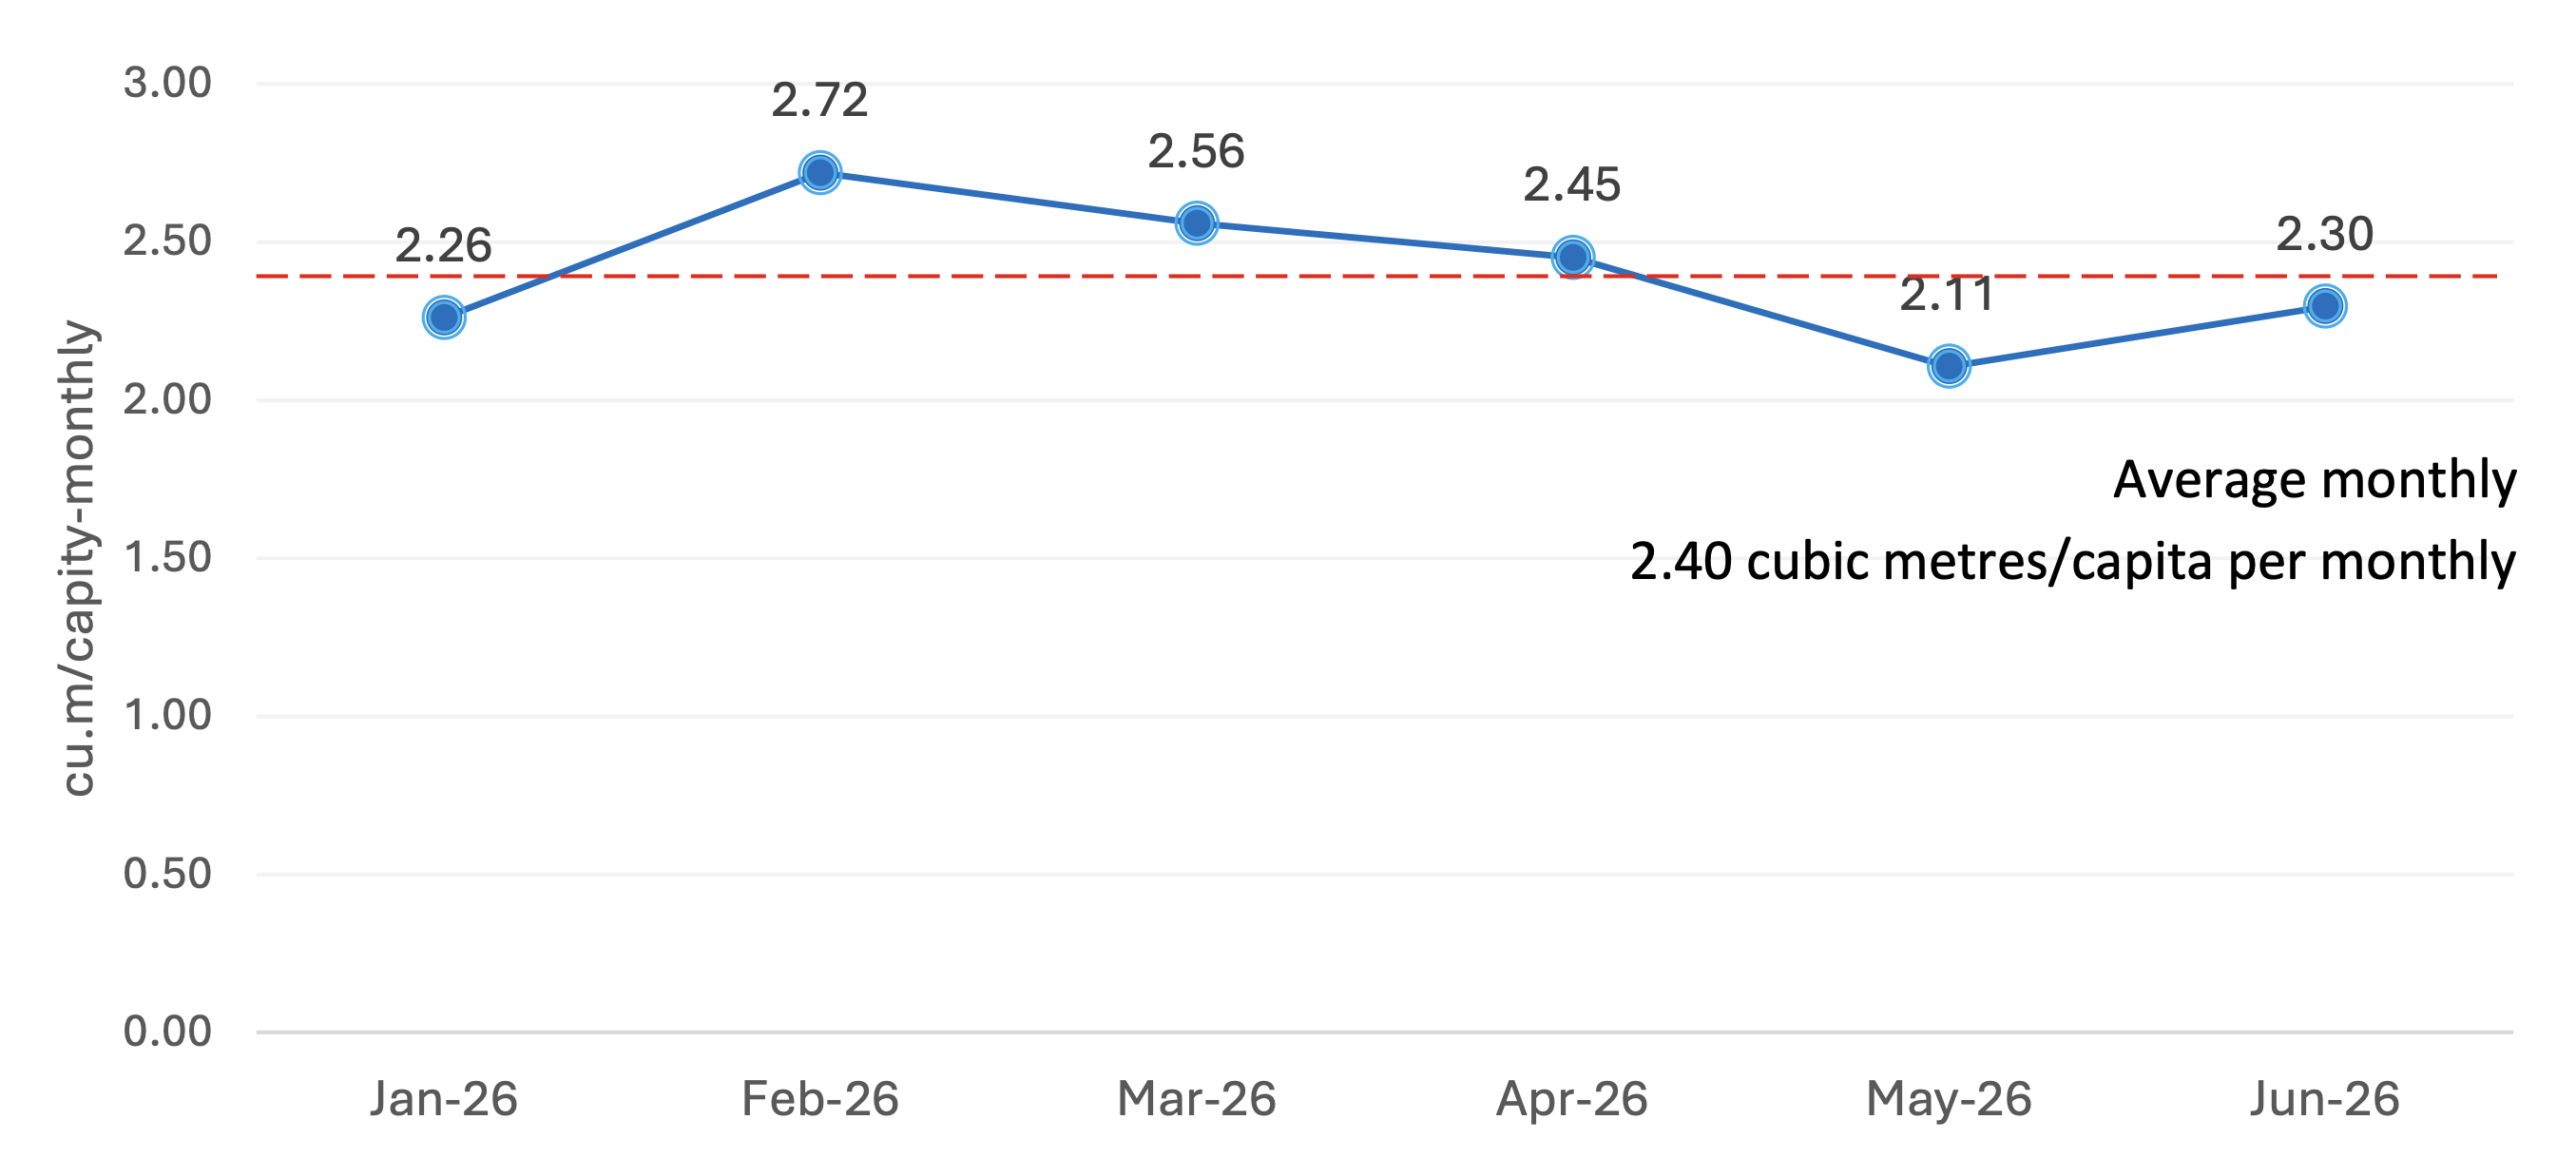
Monthly water consumption rate (cubic meters) for 2025: ranging from 2.11 to 2.72 cu.m/capita-monthly, with an average monthly rate of 2.40 cubic metres per capita.
Water consumption rate (cubic meter) from 2003 – 2026, with an average of 29.05 cubic metres per capita per year (based on 2019–2025 data).